Widget
Show one or more headline numbers with a trend
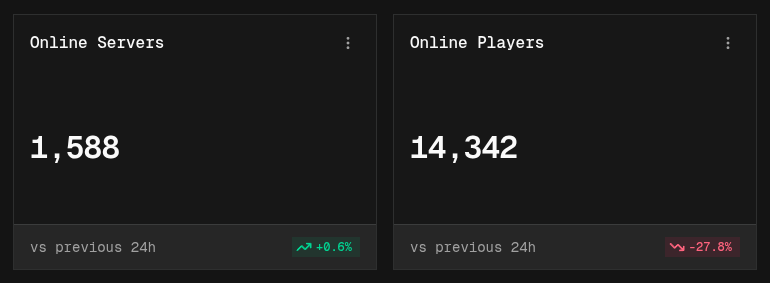
A widget shows a single number, such as the current server count or total page views, with how much it changed compared with the previous period.
Building a widget
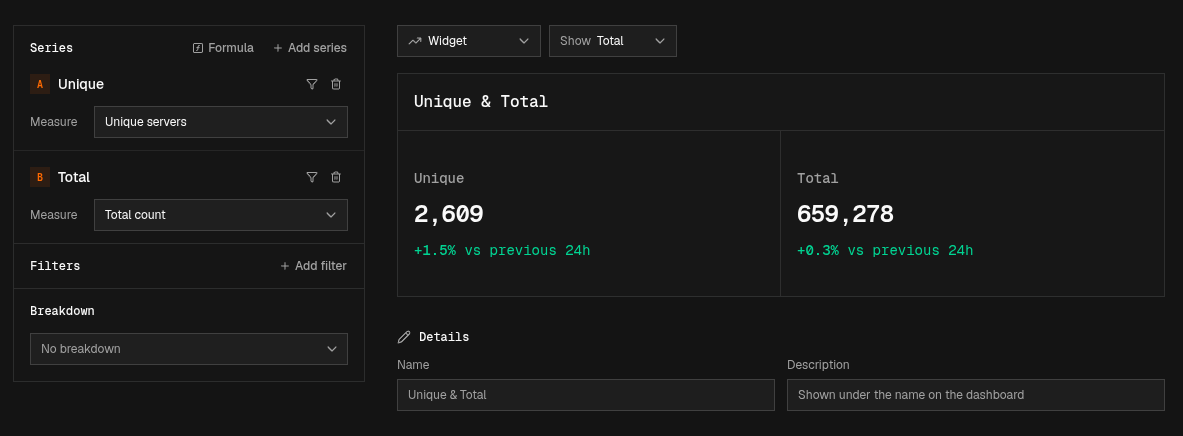
A widget shows the total of each series over the dashboard’s time range.
- Easy mode: add a series and pick a Measure. Leave Show on Total.
- Canvas mode: connect a Data Source to an Aggregate node and an Output node.
Multiple values
Add more series (or Output nodes) to show several values next to each other in one widget. Each value is labeled with its series name and gets its own trend.
Trend
Below the value, the widget shows the change compared with the previous period of the same length, for example “+1.5% vs previous 24h”. Increases are shown in green, decreases in red.