Treemap
Show the share of a total as rectangles sized by value
A treemap shows each group as a rectangle sized by its value. Like a pie chart, it shows how a total splits into parts, but it stays readable with many more groups.
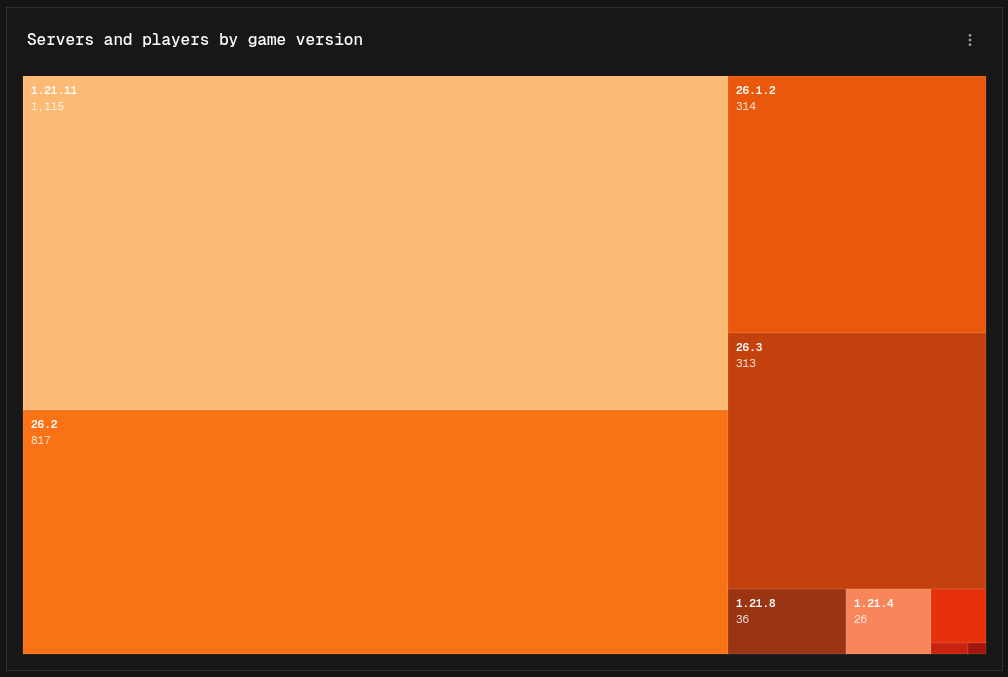
Building a treemap
- Easy mode: pick a Breakdown. Each group becomes a rectangle.
- Canvas mode: add a Group By node before the Output node.
Without a breakdown, each series becomes its own rectangle instead.
Only positive values are shown. Groups with a value of zero or less are left out.
A treemap has no extra display options.