Area
Show how values change over time with the volume filled in
An area chart works like a line chart, but fills the space below each line. It makes volume easier to see, for example total traffic over a month.
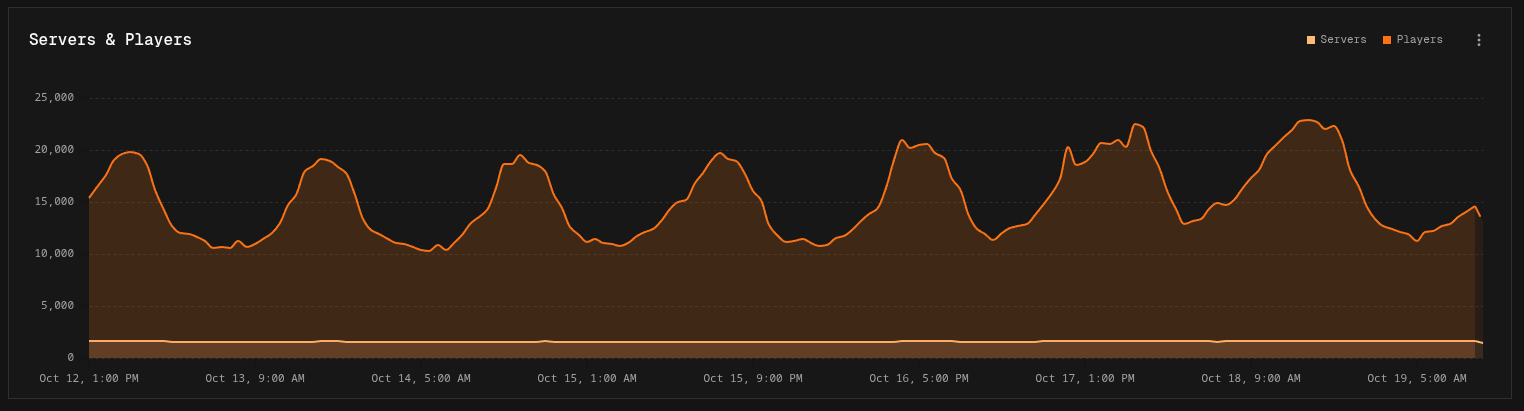
Building an area chart
Build it the same way as a line chart:
- Easy mode: set Show to an interval. Each series, or each group of a Breakdown, becomes an area.
- Canvas mode: add a Time Group node to each pipeline. Each Output node becomes an area.
Running total works the same as on line charts.
Display options
| Option | Default | Description |
|---|---|---|
| Logarithmic Scale | Off | Spaces the value axis by orders of magnitude |
| Line Style | Monotone | Monotone (smooth), Linear (straight lines), or Step |
Area charts also support Values settings and Event markers.